Analyzing Java Heap with IBM Heap Analyzer Tool - Part1

IBM Heap Analyzer tool is an eclipse based tool used to analyze the java heap.
The main aim of this section (part1) of the post is to give you an overall idea about the capabilities of the tool. Before moving into the details of Heap Analyzer tool let us have a brief look at the file naming convention of heap dump.
I am using the file "heapdump.20150617.204848.5220.0005.phd" for analysis and you can see the details of the naming convention in below figure.The last "0005" is sequence number of the file.


Start the Heap Analyzer tool (Details of starting the tools will be covered in the upcoming part of the blog) You can see the Tool versions in the background figure and also in the console.


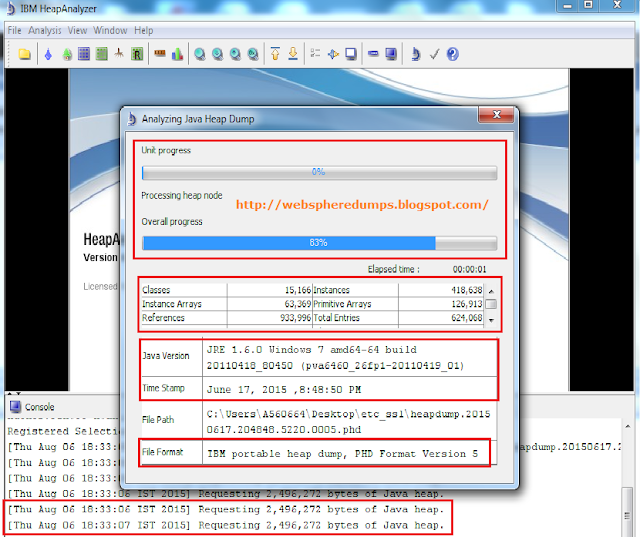
From file menu open the dump file. While opening you can see the file processing progress, Java Versions,Time stamp of the heap file generation and format of the dump file etc.
Note:- In the console you can see the Java Heap Request of the Heap Analyzer tool.

After loading the heap dump you will get below view in the tool. You can see the loaded heap dump file name, Heap dump information, Tree view of the dump file etc.
Note:- As i have used a clean dump file the "Leak Suspect" will be disabled

Below figure gives you the details of Icons used in "Tree View" of the tool.


In Analysis view you will be able to see the file format, dump file size, Time Stamp, Version of Java and Heap Usage etc.


In Tree View if you select any of the classes, Instance or Array you can see the details of that in the right pan as in the below figure.

The "Analyze" menu option has different kinds of views.

1.) Objects View.

2.) Types View.

3.)Root List.

4.)Root Types View.

As depicted in the below figure you have an option to perform "Gap Analysis" as well. (The topic "Gap Analysis" will be covered in upcoming sections of the post)

You also have different search options available in the Heap Analyzer tool.

As I mentioned initially the main idea of this post is to understand the capabilities of IBM Heap Analyzer Tool. Usage of the tool and other things will be covered in upcoming sections of the post. So keep watching this space. You can specify your mail id in the "Follow by Email" and submit so that you will get a mail alert on the posts.


Setting Java garbage collection policies

Navigate to the JVM which you want to set gc policy as mentioned in below figure.


Enter the gc policy which you want to set in the text field "Generic JVM arguments " 
other gc policies which you can set for JDK 5 are:-
-Xgcpolicy:optthruput
-Xgcpolicy:optavgpause
-Xgcpolicy:subpool

Save and synchronize the change and then restart the JVM (server1).
If you take JVM process status in unix/linux you will be able to see an entry similar to below. Below screen is from a windows javacore dump file.


Enable Tracing for troubleshooting


Navigate to “logging and tracing” and select the JVM, Here I have selected “server1”. Select “Diagnostic trace service”. Select the file radio button so that the trace loges will be logged into the file. Here you can specify maximum number of trace file size and maximum number of historical trace files also. As per below example it generates maximum 5 trace files of 20MB. You have an option to specify the log name and path. Default name is trace.log. after configuring all these select “Change log detail levels” from additional properties.


Note:-  As the JVM server1 is stopped here you can see only “configuration” tab. If it was running you can see “runtime” tab also.


Once you select  “Change log details level” you will get below screen. As I said earlier in notes since JVM (server1) is stopped here also you will get only “configuration’’ tab.
   For enabling component level tracing you can either enter the trace strings in the text box in the below screen or you can expand “All components” and select components so that it appears in the text box.
  The default trace string is “*=info”.


In Below screen I have entered trace strings to capture traces for security related components.
This will log trace details related to below specified components in “trace.log”.
Note:- Here I have started the JVM hence you can notice an additional tab called “runtime” in the screen shot.  If you specifies the details in “runtime” tab the trace logs will start writing immediately but if you specify it in “configuration” tab you need to synchronise and stop/start the JVM to get the logs. Since we specified the details here in “Configuration” tab we need to sync nodes and restart “server1“.


Below screen shows the logs directory before setting trace logs.


After syncing nodes and restarting “server1” you can see an additional log called  “trace.log” in the log directory of server1.


Do some security related changes sync/restart if required you can see the specified component traces in trace.log. Below is a snippet from trace.log.

================================================

************ Start Display Current Environment ************
WebSphere Platform 8.0.0.0 [ND 8.0.0.0 n1118.03] running with process name Prasanth-PCCell01\Prasanth-PCNode01\server1 and process id 6484
Host Operating System is Windows 7, version 6.1
Java version = 1.6.0, Java Compiler = j9jit26, Java VM name = IBM J9 VM
was.install.root = D:\IBM\WebSphere\AppServer
user.install.root = D:\IBM\WebSphere\AppServer\profiles\AppSrv01
Java Home = D:\IBM\WebSphere\AppServer\java\jre
ws.ext.dirs = D:\IBM\WebSphere\AppServer/java/lib;D:\IBM\WebSphere\AppServer\profiles\AppSrv01/classes;D:\IBM\WebSphere\AppServer/classes;D:\IBM\WebSphere\AppServer/lib
;D:\IBM\WebSphere\AppServer/installedChannels;D:\IBM\WebSphere\AppServer/lib/ext;D:\IBM\WebSphere\AppServer/web/help;D:\IBM\WebSphere\AppServer/deploytool/itp/plugins/c
om.ibm.etools.ejbdeploy/runtime
Classpath = D:\IBM\WebSphere\AppServer\profiles\AppSrv01/properties;D:\IBM\WebSphere\AppServer/properties;D:\IBM\WebSphere\AppServer/lib/startup.jar;D:\IBM\WebSphere\Ap
pServer/lib/bootstrap.jar;D:\IBM\WebSphere\AppServer/lib/jsf-nls.jar;D:\IBM\WebSphere\AppServer/lib/lmproxy.jar;D:\IBM\WebSphere\AppServer/lib/urlprotocols.jar;D:\IBM\W
ebSphere\AppServer/deploytool/itp/batchboot.jar;D:\IBM\WebSphere\AppServer/deploytool/itp/batch2.jar;D:\IBM\WebSphere\AppServer/java/lib/tools.jar
Java Library path = D:\IBM\WebSphere\AppServer/lib/native/win/x86_64/;D:\IBM\WebSphere\AppServer\java\jre\bin\default;D:\IBM\WebSphere\AppServer\java\jre\bin;.;D:\IBM\W
ebSphere\AppServer\lib\native\win\x86_64;D:\IBM\WebSphere\AppServer\bin;D:\IBM\WebSphere\AppServer\java\bin;D:\IBM\WebSphere\AppServer\java\jre\bin;C:\app\Nithya\produc
t\11.2.0\dbhome_2\bin;C:\app\Nithya\product\11.2.0\dbhome_1\bin;C:\Program Files\Common Files\Microsoft Shared\Windows Live;C:\Program Files (x86)\Common Files\Microsof
t Shared\Windows Live;C:\windows\system32;C:\windows;C:\windows\System32\Wbem;C:\windows\System32\WindowsPowerShell\v1.0\;C:\Program Files\Lenovo\Bluetooth Software\;C:
\Program Files\Lenovo\Bluetooth Software\syswow64;C:\Program Files (x86)\Windows Live\Shared;D:\IBM\WebSphere\AppServer\java\jre\bin;
Orb Version = IBM Java ORB build orb626fp1-20110419.00
Current trace specification = *=info:com.ibm.ws.security.*=all:com.ibm.websphere.security.*=all:com.ibm.websphere.wim.*=all:com.ibm.wsspi.wim.*=all:com.ibm.ws.wim.*=all
************* End Display Current Environment *************
[4/8/15 19:14:55:414 IST] 00000000 ManagerAdmin  I   TRAS0018I: The trace state has changed. The new trace state is *=info:com.ibm.ws.security.*=all:com.ibm.websphere.s
ecurity.*=all:com.ibm.websphere.wim.*=all:com.ibm.wsspi.wim.*=all:com.ibm.ws.wim.*=all.
[4/8/15 19:14:55:594 IST] 00000000 ManagerAdmin  A   TRAS0007I: Logging to the service log is disabled
[4/8/15 19:14:55:629 IST] 00000000 ManagerAdmin  I   TRAS0017I: The startup trace state is *=info:com.ibm.ws.security.*=all:com.ibm.websphere.security.*=all:com.ibm.web
sphere.wim.*=all:com.ibm.wsspi.wim.*=all:com.ibm.ws.wim.*=all.
[4/8/15 19:14:55:630 IST] 00000000 ManagerAdmin  I   TRAS0111I: The message IDs that are in use are deprecated
[4/8/15 19:14:55:708 IST] 00000000 ModelMgr      I   WSVR0800I: Initializing core configuration models
[4/8/15 19:14:56:240 IST] 00000000 ComponentMeta I   WSVR0179I: The runtime provisioning feature is disabled. All components will be started.
[4/8/15 19:14:56:350 IST] 00000000 ProviderTrack I com.ibm.ffdc.osgi.ProviderTracker AddingService FFDC1007I: FFDC Provider Installed: com.ibm.ffdc.util.provider.FfdcOn
DirProvider@2194163
[4/8/15 19:14:56:362 IST] 00000000 ProviderTrack I com.ibm.ffdc.osgi.ProviderTracker AddingService FFDC1007I: FFDC Provider Installed: com.ibm.ws.ffdc.impl.FfdcProvider
@219c293
[4/8/15 19:14:56:548 IST] 00000000 RoleBasedAuth >  RoleBasedAuthorizerNullImpl Entry
[4/8/15 19:14:56:549 IST] 00000000 RoleBasedAuth <  RoleBasedAuthorizerNullImpl Exit
[4/8/15 19:14:56:558 IST] 00000000 AdminInitiali A   ADMN0015I: The administration service is initialized.
[4/8/15 19:14:56:768 IST] 00000000 ContextManage >  getInstance Entry
[4/8/15 19:14:56:775 IST] 00000000 ContextManage 3   getInstance SecurityConfigManager instance com.ibm.ws.security.config.SecurityConfigManagerImpl@211e328
[4/8/15 19:14:56:775 IST] 00000000 ContextManage 3   isSingleDomain is true, creating one instance
[4/8/15 19:14:56:775 IST] 00000000 ContextManage >  createInstance Entry
[4/8/15 19:14:56:775 IST] 00000000 ContextManage >  getContextManagerImplFromPluginList Entry
[4/8/15 19:14:56:776 IST] 00000000 ContextManage <  getContextManagerImplFromPluginList Exit
                                 com.ibm.ws.security.auth.ContextManagerImpl
[4/8/15 19:14:56:782 IST] 00000000 ContextManage >  <init> Entry
[4/8/15 19:14:56:797 IST] 00000000 ContextManage <  <init> Exit
[4/8/15 19:14:56:797 IST] 00000000 ContextManage 3   createInstance Loaded ContextManagerImpl class: com.ibm.ws.security.auth.ContextManagerImpl
[4/8/15 19:14:56:798 IST] 00000000 ContextManage >  getContextMgrHandlerImpl Entry
[4/8/15 19:14:56:798 IST] 00000000 ContextManage <  getContextMgrHandlerImpl Exit
                                 <null>
[4/8/15 19:14:56:798 IST] 00000000 ContextManage <  createInstance ContextManagerImpl: 34743925 domainId: null Exit
[4/8/15 19:14:56:798 IST] 00000000 ContextManage >  getInvocationSubject Entry
[4/8/15 19:14:56:807 IST] 00000000 SecurityConfi >  getPropertyBool id=com.ibm.CORBA.delegateBasicAuth default=false  (admin)  Entry
[4/8/15 19:14:56:808 IST] 00000000 SecurityConfi <  getPropertyBool id=com.ibm.CORBA.delegateBasicAuth  (admin)  val=false Exit
[4/8/15 19:14:56:810 IST] 00000000 AdminDataImpl 3   Repository is null.
[4/8/15 19:14:56:811 IST] 00000000 AdminDataImpl 3   CurrentProcessData:

================================================

Hope you enjoyed , Kindly write your suggestions and comments.

Synchronization Settings.


1.) Enable service at server startup

This specifies whether the server attempts to start synchronization

2.) Synchronization interval (minutes)

This specifies the number of minutes that elapse between two synchronizations

3.) Automatic synchronization.

Enables/Disables automatic synchronizations. If it is enabled the nodeagent attempts synchronization when it establishes connection with the dmgr and then onwards after every synchronization interval.

4.) Startup synchronization.

Specifies whether nodeagent attempts to synchronize configuration before starting of application servers.

5.) Exclusions.

Specifies files or patterns that should not be part of synchronization The files/patterns specified here will not be copied to nodes during synchronization and it will not be deleted from nodes as well.

Retrieving Certificate from Port - Admin Console

Admin Console- Retrieving Certificate from Port


Enter the hostname port number, Select the SSL repotire which you want to store the certificate, enter the Alias name and click “Retrieve Signer Information”


In Below screen you can see the retrieved certificate. Click Apply


Save and synchronize the configuration.


Here you can see the certificate which you retrieved from the port


Importing Signer Certificate to WebSphere Application Server

Importing Signer Certificate to WebSphere Application Server

First of all let us create a self-signed certificate and extract the certificate to  “C:\Users\Prasanth\Desktop\Misc\cert.arm”  (You can refer my previous blogs to know about self-signed certificate creation)
Below (Figure 1) is the certificate which I have created. Note down the values in red box, The Application Server Trust Store should contain the same values if imported properly.


                                                                      Figure 1

  
Open the WebSphere Application Server Admin Console and Navigate to the mentioned path in Figure 2 (SSL certificate and key management > Key stores and certificates > CellDefaultTrustStore > Signer certificates > Add signer certificate)  Provide an Alias name for the certificate, Mention the path of the certificate you want to import  and press Apply


                                                       Figure 2

Next screen will provide you the details of the certificate, Compare the values with figure 1 (certificate created) and make sure that the values are correct. Save and synchronize the nodes.


                                                     Figure 3

Now you can see the imported signer certificate


                                                   Figure 4

Note:-  Security related changes may call for a restart.

Kindly post your comments

WebSphere Application Server & Java Versions


Java versions of corresponding WebSphere Application Server.

WebSphere Application Server V8.5
Java SDK 7
WebSphere Application Server V8.0
Java SDK 6.0.1
WebSphere Application Server V7.0
Java SDK 1.6.0 
WebSphere Application Server V6.1
Java SDK 1.5.0
WebSphere Application Server V6.0
Java SDK 1.4.2 
WebSphere Application Server V5.1.1
Java SDK 1.4.2 
WebSphere Application Server V5.1
Java SDK 1.4.1 
WebSphere Application Server V5.0
Java SDK 1.3.1 

Note:- WebSphere Application Server and SDK Fixpacks are bundled together from Version 8.0 onwards. SDK Fixpacks are even available separately.


Configuring and Managing IBM WebSphere Application Server Cluster – Step by Step


Let us examine how to create configure and manage an application server cluster.

Step-1

Clusters à WebSphere application server clusters àNew


Step-2

Mention the cluster name and click Next


Step-3

Mention the name of the first cluster member, Select the node on which cluster needs to be created, select the template for first cluster member and click Next.


Note:- Three options are available for selecting the template. You can create the first cluster member by selecting already available templates with the product. (The templates available with the application server product). The other option to create the first cluster member is by selecting already created server as a template. ie  The member will be created similar to the existing application server. The last option is that you can convert the existing application server itself as a cluster member.

Difference between second and third option is that in the case of second option existing application server will not have any change but in the case of third option existing server itself will be converted as a cluster member.


Step-4

Mention the next cluster member name, select the Node on which cluster member needs to be created and click “Add Member”. The same step can be repeated for adding further members as per requirement. Note that here you will not get any option for selecting the template because the first cluster member will be the baseline for all further members which you are adding to the cluster.


After adding member, the member will be listed in the table at the bottom of the screen.


Click Next after adding all the members.

Step-5
This will take you to the summary screen where you can verify all the details. Click Finish to create the cluster and the members.


 Step-6
Save and synchronize the nodes.


You can notice the cluster name here and the cluster will be in stopped state.
With the above step we have created a cluster “My Cluster”  with two cluster members (FirstMember,SecondMember).

Now you can click on “MyCluster” which will take you to below screen.


Click on Details.
Start/Stop Cluster from admin console – Method 2

Here you can update the weight if you want. Also notice that the members will be in stop state. Also you can select the members and start/stop it.


 Start/Stop Cluster from admin console – Method 2
To start/stop the cluster you can go to  Clusters à WebSphere application server clusters àSelect  MyCluster and the click on start/stop.


Ripplestart: Ripplestart will restart the cluster members one by one without any downtime, ie it will stop one member start it and then proceed with the next member.

Start/Stop Cluster from admin console – Method 3
Go to WebSphere application servers in the console you will get below screen select the cluster members and then start/stop the same.


Below screen will give you the cluster topology.